Regression Outcome Accuracy
55%
from predicted goals -> win/draw/loss
Machine Learning + Soccer Analytics
End-to-end pipeline from FBref scraping to model evaluation, with two approaches: score forecasting (regression) and direct result prediction (classification).
Project details, modeling notes, and full methodology: View the full GitHub README.
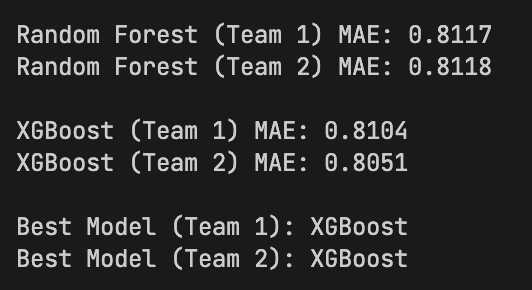
Regression Outcome Accuracy
55%
from predicted goals -> win/draw/loss
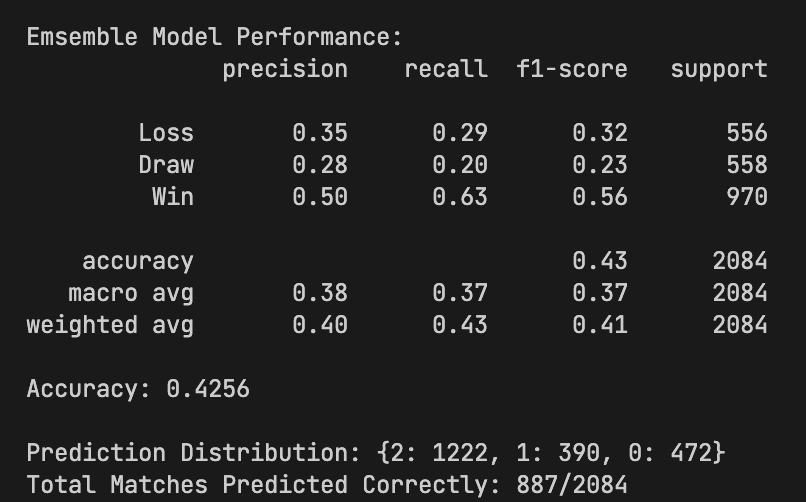
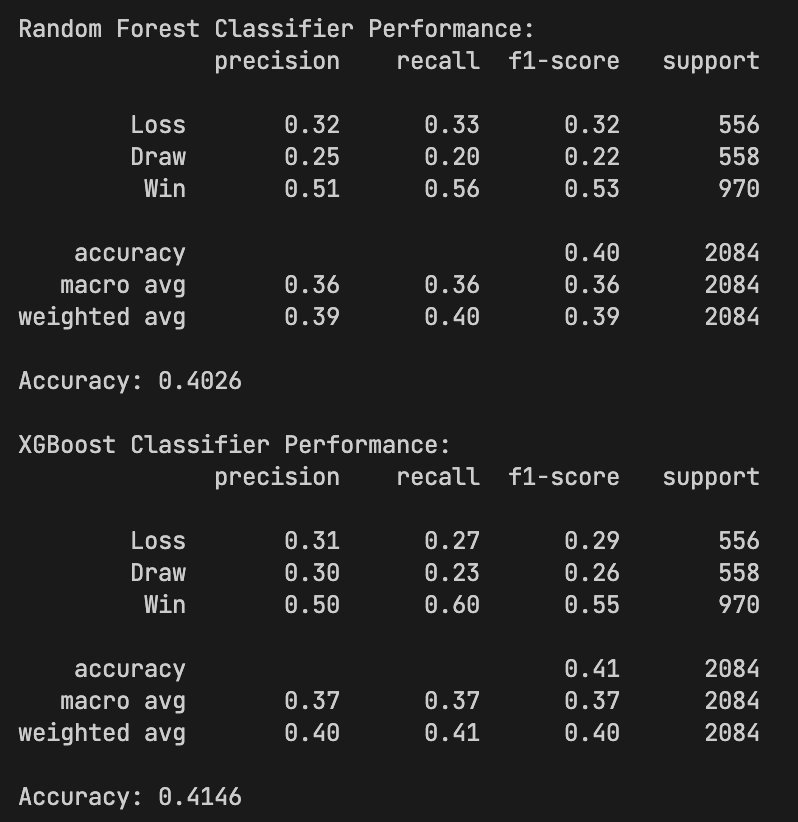
Classification Ensemble Accuracy
42%
direct multiclass prediction
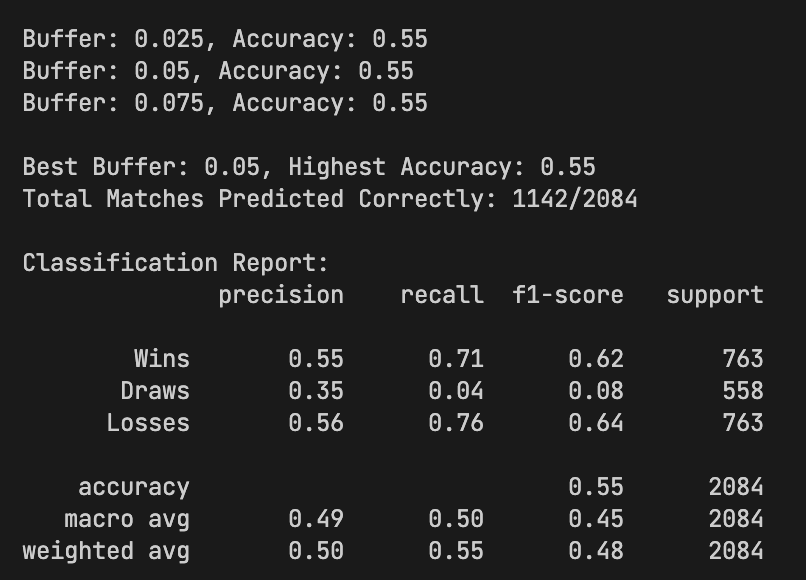
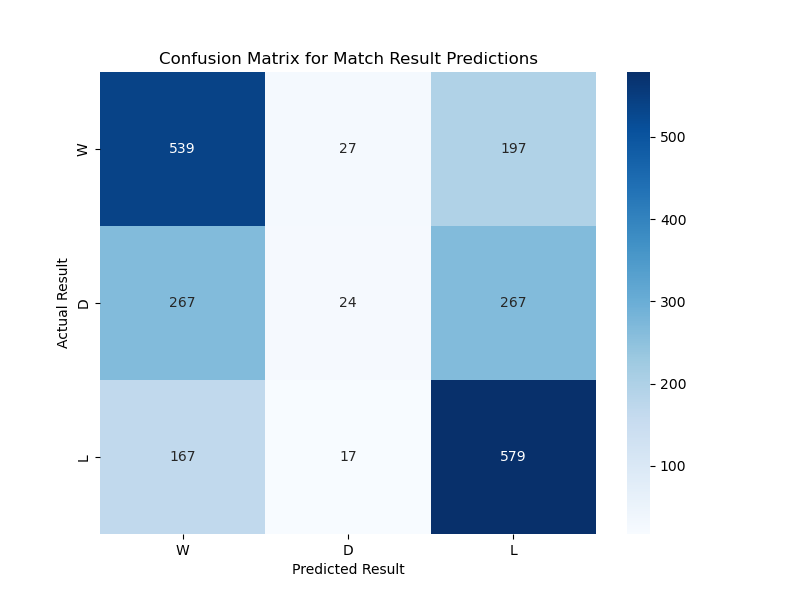
Regression Recall (Wins / Losses / Draws)
71% / 76% / 4%
draw prediction remained hardest
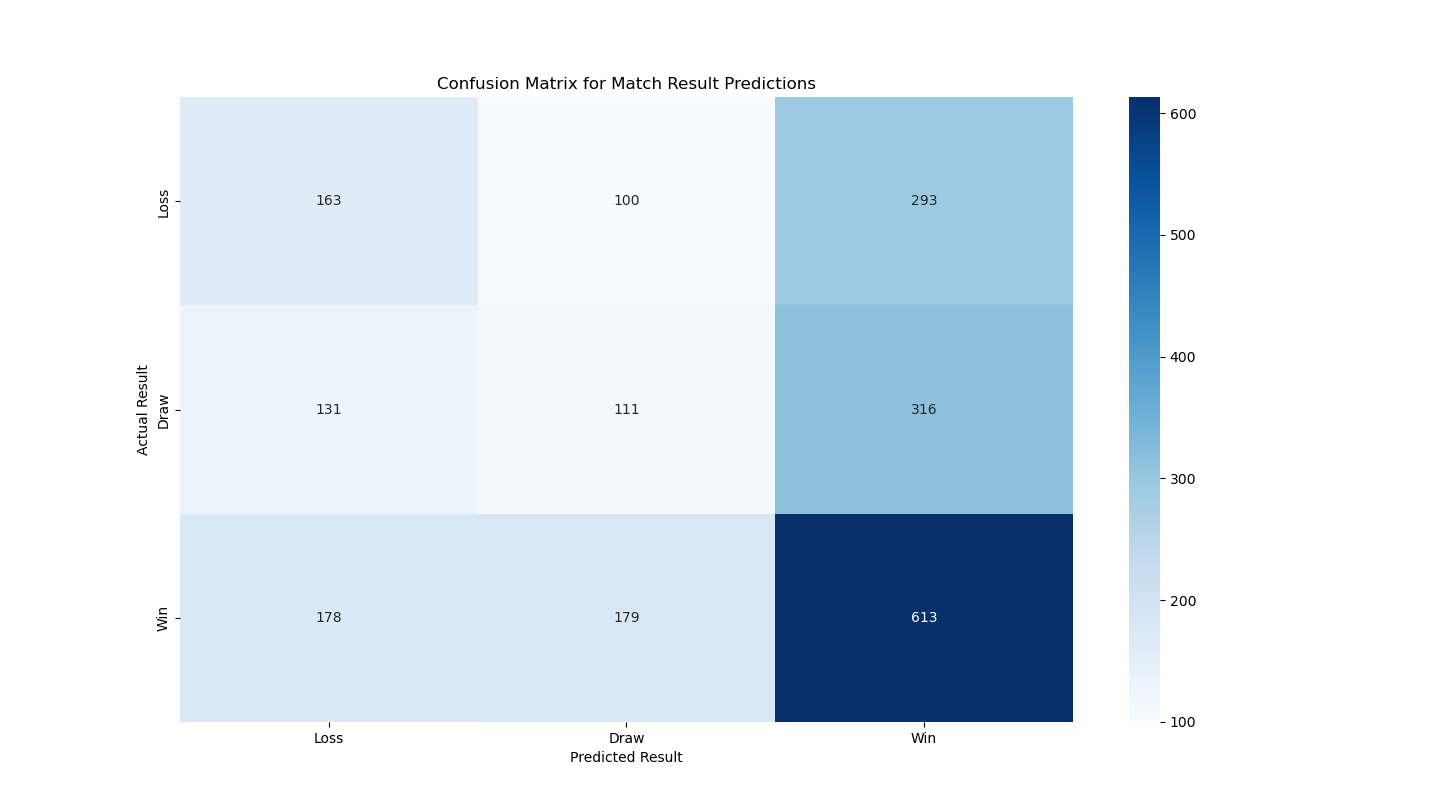
Classification Recall (Wins / Losses / Draws)
63% / 29% / 20%
class imbalance impacts draws + losses
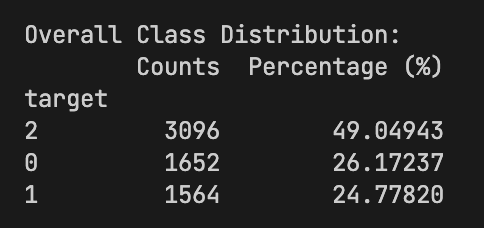
Your data already shows structural difficulty: draws are only 24.8% overall (1,564 of 6,312 rows), while home-perspective outcomes are skewed (3,096 wins vs 1,652 losses). In this setup, direct classification tends to overpredict wins and underperform on draws/losses.
MLS has also shifted quickly during this window (2018-2024): team count in your data rises from 23 to 29, roster mechanisms are unique and evolving (DP + GAM/TAM + U22), and competition formats have changed. Those shifts create non-stationarity that makes historical patterns less stable for ML models.
Pick a team and season to inspect per-match performance and compare it to that season's league average.